
This forum (which is now CLOSED, sorry!) contains essays by hundreds of people preparing for the IELTS between 2012 and 2013. They helped each other to become better writers by reading each other's essays and commenting on them.
Please enjoy the hundreds of essays and thousands of comments still available here. A HUGE thanks to all the brave young writers who commented and to all the visitors. We hope we've made IELTS writing less scary.
art business children communication crime culture economy education environment families food freedom globalization health heritage leisure media politics science society sports television travel technology transport university violence work
 Log In
 Writefix Forum

 Topic RSS
 Related Topics

 (1 votes)
 Offline


Hey, Enda, this is my IELTS part 1 job. I found that I am quite confused with the structure of my work. I realized my work is awful. So please help me. I want to know how to fix my essay and improve it. Thanks
The charts below give information about travel and from the UK, and about the most popular countries for UK residents to visit. Summarise the information by selecting and reporting the main features, and makes comparisons where relevant.
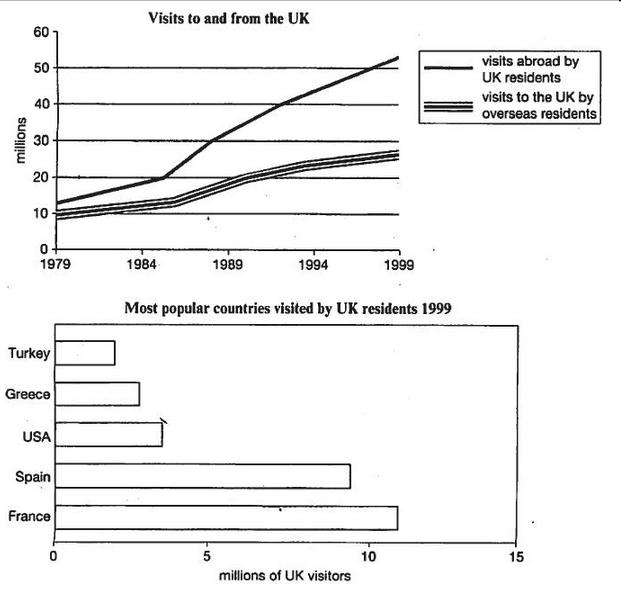

The line graph portrays the number of visitors to and from the UK, while the bar chart illustrates the most popular countries by UK residents 1999.
According to the line graph, the disparity between these two groups was keep expanding over the 20 years span. Specifically, only around 12 million visitors had been chosen visiting abroad by 1979. The number was rising marginally to 20 million until 1986. Then, the visitor’s number jumped to approximately 53 million at the end of 1999. While the increasing speed of visitors travel to the UK was much slower during the 2 decades, from 20 million to 27 million.
As shown in the bar chart, there were five countries relatively popular to UK residents in 1999. France was the most attractive country where attracted 11 million UK visitors. At the meantime, Spain had been chosen by 9 million UK residents. The figure of other three nations- USA, Greece and Turkey were close, served 4 million, 3.5 million and 3 million tourists respectively around this year.
Overall, even though the number of visitors from abroad expanded almost 3 times over the two decades span, the gap between enter and leave the country was enlarged gradually. One third UK visitors chose France and Spain as their destinations.
5:09 pm

Hi David
- Try to be consistent with tense. I would use all simple past in this answer.
- Don’t use phrases at the start of every sentence (Specifically, As shown, At the meantime, Then, etc.) It gets very repetitive and is called "overuse of cohesive devices." Just give the information. It's only 150 words - it shouldn't be so difficult to follow.
- Put the ‘overall’ sentence in the introduction.
The second biggest feature is that the number of people visiting the UK also increased sharply, from 10 million, to almost 30 million, a threefold increase.
Comparing the two would come a little later. Here's my suggested rewrite:
| The line graph portrays the number of visitors to and from the UK, while the bar chart illustrates the most popular countries visited by UK residents 1999. | The line graph shows visitors to and from the UK between 1979 and 1999, while the bar chart shows the most popular countries for British tourists in 1999. |
| According to the line graph, the disparity between these two groups was keep expanding grew over the 20 years span. Specifically, only around 12 million visitors had been chosen visiting abroad by in 1979. The number was rising rose marginally to 20 million until 1986. Then, the visitor’s number number of visitors jumped to approximately 53 million at the end of 1999. While the increasing speed of visitors travel to the UK was much slower during the 2 decades, from 20 million to 27 million. | The biggest change over the period was the rise in the number of UK residents traveling abroad. There was a 400% increase from 12 million foreign trips in 1979 to over 50 million in 1999. The number of visitors to the UK also rose sharply. It rose slightly from 10 million in 1979 to around 13 million in 1986, and then increased more rapidly to reach 28 million in 1999. |
| As shown in the bar chart, there were five countries relatively popular to with UK residents in 1999. France was the most attractive country where attracted with11 million UK visitors. At the meantime, Spain had been chosen was chosen by 9 million UK residents. The figure of other three nations- USA, Greece and Turkey were close, served with 4 million, 3.5 million and 3 million tourists respectively around this yea in 1999 | The bar chart shows the five top destinations for UK holidaymakers in 1999. France, with 11 million British visitors, and Spain, with just under 10 million, were by far the most popular countries. In contrast, the US, Greece and Turkey each had fewer than 3 million UK visitors. |
| Overall, even though the number of visitors from abroad expanded almost 3 times over the two decades span, the gap between enter and leave the country was enlarged grew gradually. One third of UK visitors chose France and Spain as their destinations. | Overall, it appeared that more and more Britons travelled abroad over the two decades, and there was a similar though smaller increase in the number of visitors to the UK. In 1999, Spain and France accounted for almost half of all trips made by British tourists. |
Your work is not awful at all!
Just watch the tense, put the overall sentence near the start, and try to decide on the main features.
Thanks Enda, I will try to correct my gramma mistakes. Just use the simple style of gramma which could control mistakes efficiently.
I have another question, if I write my conclusion at first, what I goona do in the last paragraph?
First graph, rewrite the topic indrodution and write a conclusion. Portray/discribe the characteristics of the graph/table in the middle part. Finally, ?
Thanks again, have a nice day.==
10:35 am
DavidLee asked what to put in the last paragraph in Task 1.
Well, you are not required to have a last or conclusion paragraph. It's not like Task 2
However, I recommend that you have a conclusion.
Here's the thing: in IELTS you will usually get a graph (or map, or diagram, or table, or process, or cycle) which has enough content/figures/data/patterns/trends for you to have TWO trends.
In other words, there will probably be TWO trends in any Task 1 - not just one. My suggestion is to put the big one, the main one, the one that jumps out at the reader, in the second sentence ("Overall,,...") and to put the second one/both of them in the conclusion. No numbers or percentages, but perhaps a word like the 'majority' or 'a large proportion' or 'over half.'
Don't add new information in your last paragraph. If it's an important trend or piece of information, you need to deal with it in the body.
If necessary, or if you can't think of a secondary trend, just rephrase the main trend - repeat what you said in the second sentence.
Most Users Ever Online: 760
Currently Online: Mr Writefix
1 Guest(s)
Top Posters:
Brian_mcclaine: 90
alison32559905: 88
David Lee: 67
ma-frank: 54
katisss: 51
Tommy Bui: 42
Nick: 39
essays: 36
chrisluke921221: 35
alia: 34
rshdwork: 32
youtthasack: 31
linpearl89: 29
rose2802: 28
madinarafi5: 28
Member Stats:
Guest Posters: 1
Members: 172
Moderators: 1
Admins: 2
Forum Stats:
Groups: 1
Forums: 3
Topics: 545
Posts: 2204
Newest Members:
Newestadmin, newadmin, Mr Writefix, charrmaineModerators: Newestadmin: 0
Administrators: Enda Tuomey: 0, newadmin: 0
 Usage Policy