
This forum (which is now CLOSED, sorry!) contains essays by hundreds of people preparing for the IELTS between 2012 and 2013. They helped each other to become better writers by reading each other's essays and commenting on them.
Please enjoy the hundreds of essays and thousands of comments still available here. A HUGE thanks to all the brave young writers who commented and to all the visitors. We hope we've made IELTS writing less scary.
art business children communication crime culture economy education environment families food freedom globalization health heritage leisure media politics science society sports television travel technology transport university violence work
 Log In
 Writefix Forum

 Topic RSS
 Related Topics

 (0 votes)
 Offline


The graph below shows the proportion of the population aged 65 and over between 1940 and 2040 in three different countries.
Summarise the information by selecting and reporting the main features, and make comparisons where relevant. Write at least 150 words.
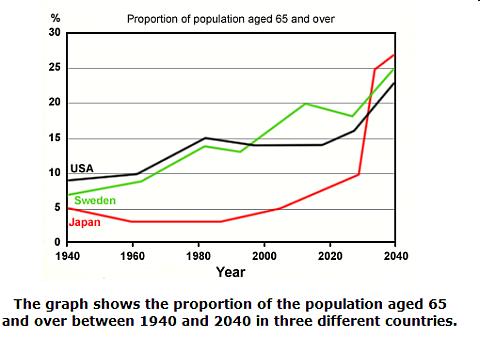

The line graph portrays the percentage of the elderly who beyond 65 in three countries- Japan, Sweden and USA from 1940 to 2040. Each line had an increasing tendency over the 1 century.
According to the line graph, the changing of Japan was the most dramatic. Specifically, there were only 5% old individuals live in Japan since 1940. Then, the rate had decreased to 3% gradually by 1960. The proportion kept stable before the figure grew back to 5% in 2010. In the latest 30 years, the number would jump from 5% to approximately 27%. Japan will become the country which holds the largest rate of older people.
Sweden and USA had the similar tendency. In 1940, the ratio in Sweden and USA are larger than Japan, 7% and 9% respectively. The increasing speed in Sweden was faster than USA and overpassed them in 2000. After that point onwards, both two nations continued surging, and will be surpassed by Japan around 2035. Finally, Sweden and USA would stand at 25& and 23% correspondingly.
Overall, the percentage of aged people will probably continue to increase during the next 20 years. Even though Japan kept the lowest rate around 90 years, it is anticipated take over the first place in 2040.
Text Statistics
No. of sentences 15
No. of words 209
No. of complex words 18
Percent of complex words 8.61%
Average words per sentence 13.93
Average syllables per word 1.43
Hey, Enda, my part 1 is really awful, u can see my work. I guess some structure must be wrong. How can I improve it efficiently?
Thanks so much.
DavidLee said
The graph below shows the proportion of the population aged 65 and over between 1940 and 2040 in three different countries.
The line graph portrays (I think the word portray'snot suitable here)the percentage of the elderly who beyond 65 in (there're some problem)three countries- Japan, Sweden and USA from 1940 to 2040. Each line had? an increasing tendency over the 1 century.
According to the line graph(u should'nt use this phrase), the changing of Japan was the most dramatic. Specifically, there were only 5% old individuals live in Japan since 1940. Then, the rate had decreased to 3% gradually by 1960. The proportion kept stable before the figure grew back to 5% in 2010. In the latest 30 years, the number would jump from 5% to approximately 27%. Japan will become the country which holds the largest(highest) rate of older people.(it seems a bit awkward here)
Sweden and USA had the similar tendency(repitition). In 1940, the ratio in Sweden and USA are larger than(that of) Japan,(U should find an appropriate preposition here) 7% and 9% respectively. The increasing(increased) speed in Sweden was faster than USA and overpassed them in 2000. After(from) that point onwards, both two(redundant) nations continued surging, and will be surpassed by Japan around 2035. Finally, Sweden and USA would stand at 25& and 23% correspondingly.
Overall, the percentage of aged people will probably continue to increase during the next 20 years. Even though Japan kept the lowest rate around 90 years, it is anticipated take over the first place in 2040.
Hello I have some comment on ur essay as above.U should vary ur structures to get a higher score.Otherwise I ike it and u've discribed the overall trend.:) Drop by and feel free to comment on my essay too.
3:21 pm

Hi DavidLee
It's not really awful. Your basics are OK and your vocabulary choice is fine, but make sure to remember that these are people. As Ruby suggest, you need to vary the structures. What does she mean? Let's look at one of your paragraphs.
One point I would love people to remember about graphs in IELTS is that there are usually PEOPLE behind the lines and numbers and tables. You wrote:
Sweden and USA had the similar tendency. In 1940, the ratio in Sweden and USA are larger than Japan, 7% and 9% respectively. The increasing speed in Sweden was faster than USA and overpassed them in 2000. After that point onwards, both two nations continued surging, and will be surpassed by Japan around 2035. Finally, Sweden and USA would stand at 25& and 23% correspondingly.
What is this paragraph about? Yes, you’ve described a few lines and said if they go up or down. That's OK. It's like the cartoon here:

But behind the graph, there are people. Nowhere in this paragraph have you mentioned people: Elderly people, old people, the number of young people, the number of old people, the working population, how many young people will have to take care of the older people, etc.

This is called a ‘mechanical’ description (Have a look at the official descriptors for IELTS Task 2 Writing (public version), under Task Fulfillment.)
You do mention people in your final paragraph, but it’s important to remember throughout.
Word Choice/Word Form/Usage
- The line graph portrays the percentage of the elderly who beyond 65 in three countries → The line graph portrays the percentage of the elderly who are over/ are aged over/ 65 in three countries
- Each line had an increasing tendency over the 1 century. → Each line had an increasing tendency over the century. NO!
- The number of older people as a percentage of the population will increase sharply in all three countries.
- Specifically, there were only 5% old individuals live in Japan since 1940. → Only 5% of Japanese people in 1940 were over 65.
- Then, the rate had decreased to 3% gradually by 1960 → Then, the proportion/percentage of people over 65 years decreased gradually to 3% by 1960 [Keep the adverb near the verb, and it’s not a rate – it’s a percentage or a proportion.]
- In 1940, the ratio in Sweden and USA are larger than Japan, 7% and 9% respectively → In 1940, the ratio in Sweden and USA are larger than Japan, with/at 7% and 9% respectively.
You wrote:
The increasing speed in Sweden was faster than USA and overpassed them in 2000. After that point onwards, both two nations continued surging
This needs a complete rewrite:
The number/percentage/proportion of older people in Sweden grew more quickly than in the USA, where the proportion stayed steady at 14% of the population. From 1995 onwards, the percentage of Sweden’s elderly began to rise sharply and is expected to reach 1 in 5 of the population by 2015.
The proportion of people over 65 in America is predicted to rise rapidly from 15% in 2020 to almost one quarter of the population in 2040.
However, Japan will have the sharpest rise in the proportion of old people. It is estimated that the percentage will jump from just 10% of the population in 2030 to almost 25% in 2040. In other words, there will be only three younger people for every Japanese pensioner over 65 in 2040.
So your basics are OK and your vocabulary choice is fine, but make sure to remember that there are people, not just lines!
Most Users Ever Online: 760
Currently Online: Mr Writefix
1 Guest(s)
Top Posters:
Brian_mcclaine: 90
alison32559905: 88
David Lee: 67
ma-frank: 54
katisss: 51
Tommy Bui: 42
Nick: 39
essays: 36
chrisluke921221: 35
alia: 34
rshdwork: 32
youtthasack: 31
linpearl89: 29
rose2802: 28
madinarafi5: 28
Member Stats:
Guest Posters: 1
Members: 172
Moderators: 1
Admins: 2
Forum Stats:
Groups: 1
Forums: 3
Topics: 545
Posts: 2204
Newest Members:
Newestadmin, newadmin, Mr Writefix, charrmaineModerators: Newestadmin: 0
Administrators: Enda Tuomey: 0, newadmin: 0
 Usage Policy