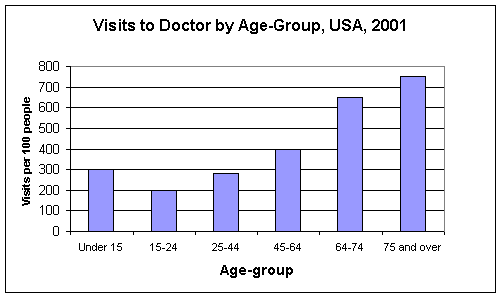
In IELTS, you will often get two or three graphs or tables, and you have to relate them to each other. Don’t just write one paragraph about each.
The two charts below give information on visits to doctors in the US.
Click here for a quiz in a new window, or click below for a text
Factoids:
- In 2001, 880 million visits were made to physicians’ offices in the US – about 3.1 visits per person.
- Between 1992 and 2002, the visit rate for people 45 and older increased by 17%, from 4.1 to 4.8 visits a year.
- The visit rate for white people (3.4 visits) was much higher than the rate for black or African-American people (1.9 visits a year).
- In an average week, a physician had 80 visits, 16 telephone consultations, 13 hospital visits and 1 house call.
- Over 7.5% of patients had no visits in the last 12 months, but 26% had six or more visits in the previous 12 months
More stuff!
- An activity from Bogglesworldesl.com A Visit To The Doctor
- Scrambled medical words from literacy.net. Or try a crossword from the same site
- The idebate.org website has dozens of topics with arguments for an against. Great if you are writing an IELTS essay on a controversial topic. Try this one on universal free medical care.
- Dozens of statistics on the US from ‘The First Measured Century’ published by PBS.
- Google’s new Public Data Explorer allows you to compare countries and to create your own graphs.

