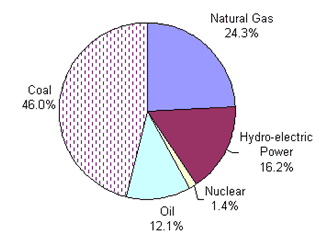
Look at the graph at this Abu Dhabi Men’s College page which gives information about how electricity in the US was produced in 1970. 
Activity 1
Answer these questions:
- US Electricity Production by Source, 1970
- In 1970, coal production _________________ 46% of US electricity production.
- Almost a quarter of US electricity in 1970 _________________ using natural gas.
- Hydro-electric power stations _________________ just over 16% of US power in 1970.
- Nuclear power _________________ less than 2% of US electricity supplies in 1970.
- The main fuel used to generate electricity in 1970 in the US _________________ coal.
- Almost half of US electricity in 1970 _________________ from coal.
- About _________________ of US electricity came from oil-fired power stations.
- Gas and coal provided _________________ of US electricity in 1970.
- Nuclear power contributed a tiny _________________ of US electricity in 1970.
- Renewable sources of electricity, such as hydroelectric power, made up _________________ 17% of US electricity in 1970.
- Gas and oil _________________ just over a third of US electric power.
From http://www.admc.hct.ac.ae/hd1/english/graphs/electricityquiz.htm
Activity 2
Now go to http://tinyurl.com/6ey880z which gives figures for 2010. Open Excel and type the data Make a pie chart. Compare the two graphs. Write about 150 words. Print one page with the two graphs and your 150 words.
Useful vocabulary
accounted for, contributed, came, supplied, comprised, generated,
less than, made up, one-eighth, proportion, supplied, was,
three-quarters, produced, was produced
Activity 3

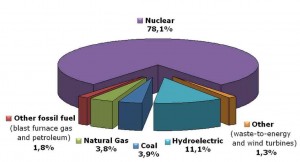
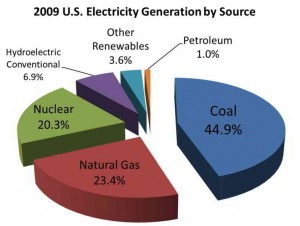
Visit http://en.wikipedia.org/wiki/Electricity_generation and compare the two graphs on how electricity is generated in France and the US in 2009.