This is the first part of a short introduction to writing about Graphs.
What are Graphs and Charts?
Graphs, charts, and tables are ways of presenting information. Graphs and charts are pictures which show numbers or figures, and tables are just rows and columns of information.
This a table. It shows the population of the world’s top ten cities in 2011.
| 1 | Tokyo | Japan | 32,450,000 |
| 2 | Seoul | South Korea | 20,550,000 |
| 3 | Mexico City | Mexico | 20,450,000 |
| 4 | New York City | USA | 19,750,000 |
| 5 | Mumbai | India | 19,200,000 |
| 6 | Jakarta | Indonesia | 18,900,000 |
| 7 | Sáo Paulo | Brazil | 18,850,000 |
| 8 | Delhi | India | 18,680,000 |
| 9 | Osaka/Kobe | Japan | 17,350,000 |
| 10 | Shanghai | China | 16,650,000 |
From: http://www.worldatlas.com/citypops.htm
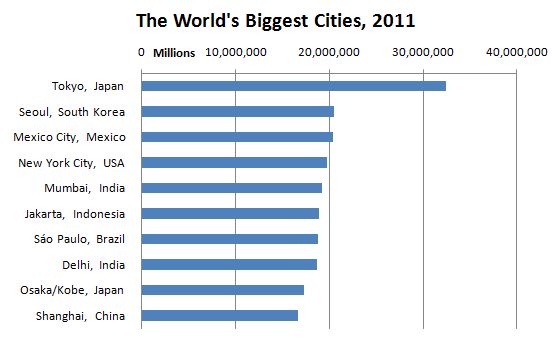
Here is the same data (for the top ten cities) in a bar chart. Which is easier to read or understand – the table or the bar chart?
